| dESPair CodaBot Info & Tutorial
| INDEX 1) What is CodaBot ? | |
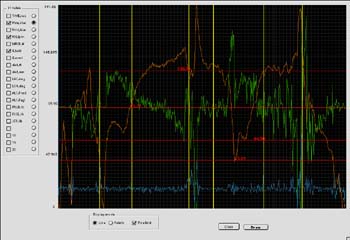
| You can have the datapoints being plotted as points, or as lines. If you have downsampled the data 1:100, you may be better off with lines. Drawing points is a bit faster if you display multiple categories at once. |  | |
| To the right, you see a sample screen of the plotter. I have clicked the canvas a couple of times and got the yellow vertical lines. Command-clicking
Ctrl-Clicking or changin any radiobutton or checkbox redraws the plots and erases all lines.
|  | |
| Next Chapters >>> | ||